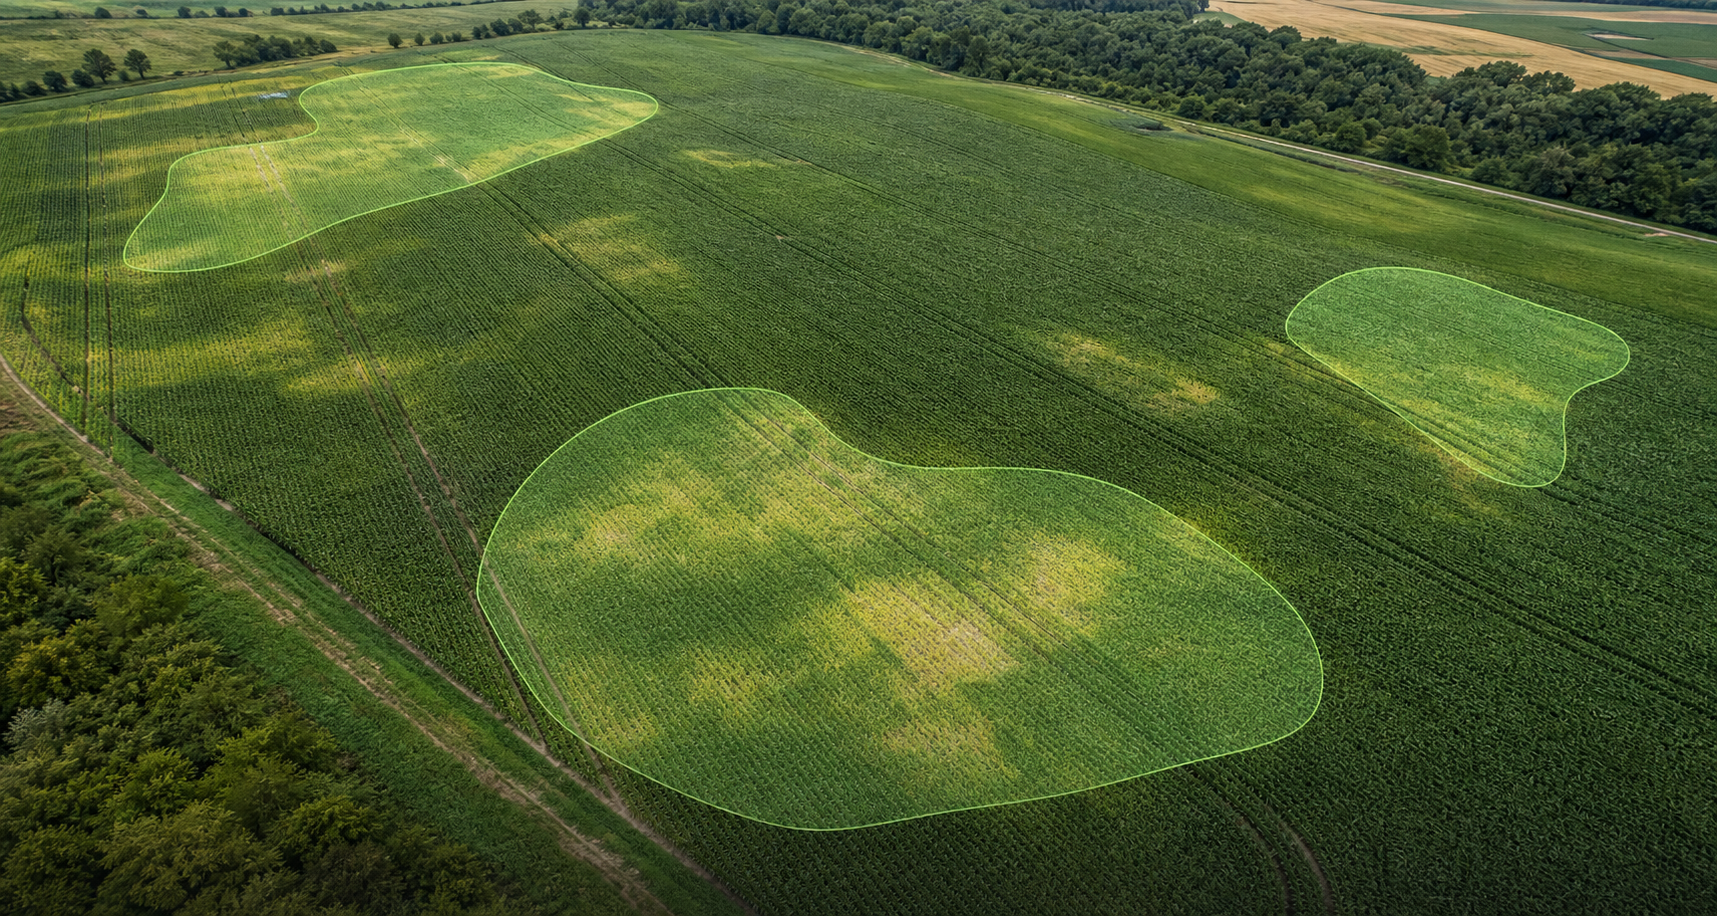
Uneven crop growth is a field signal, not a final diagnosis
A field rarely grows exactly the same from one end to the other. Farmers may notice darker and lighter green areas, uneven plant height, delayed maturity, yellow patches, thinner stands, or places where crop cover looks weaker than expected.
Those differences matter, but they are not the final answer by themselves. Uneven crop growth means the field is not responding uniformly. The cause may be agronomic, environmental, operational, or equipment-related.
A map, drone image, satellite layer, or field scouting map can help locate the pattern quickly. Still, the final judgment should come from field scouting, weather history, soil conditions, crop stage, and local agronomic knowledge.
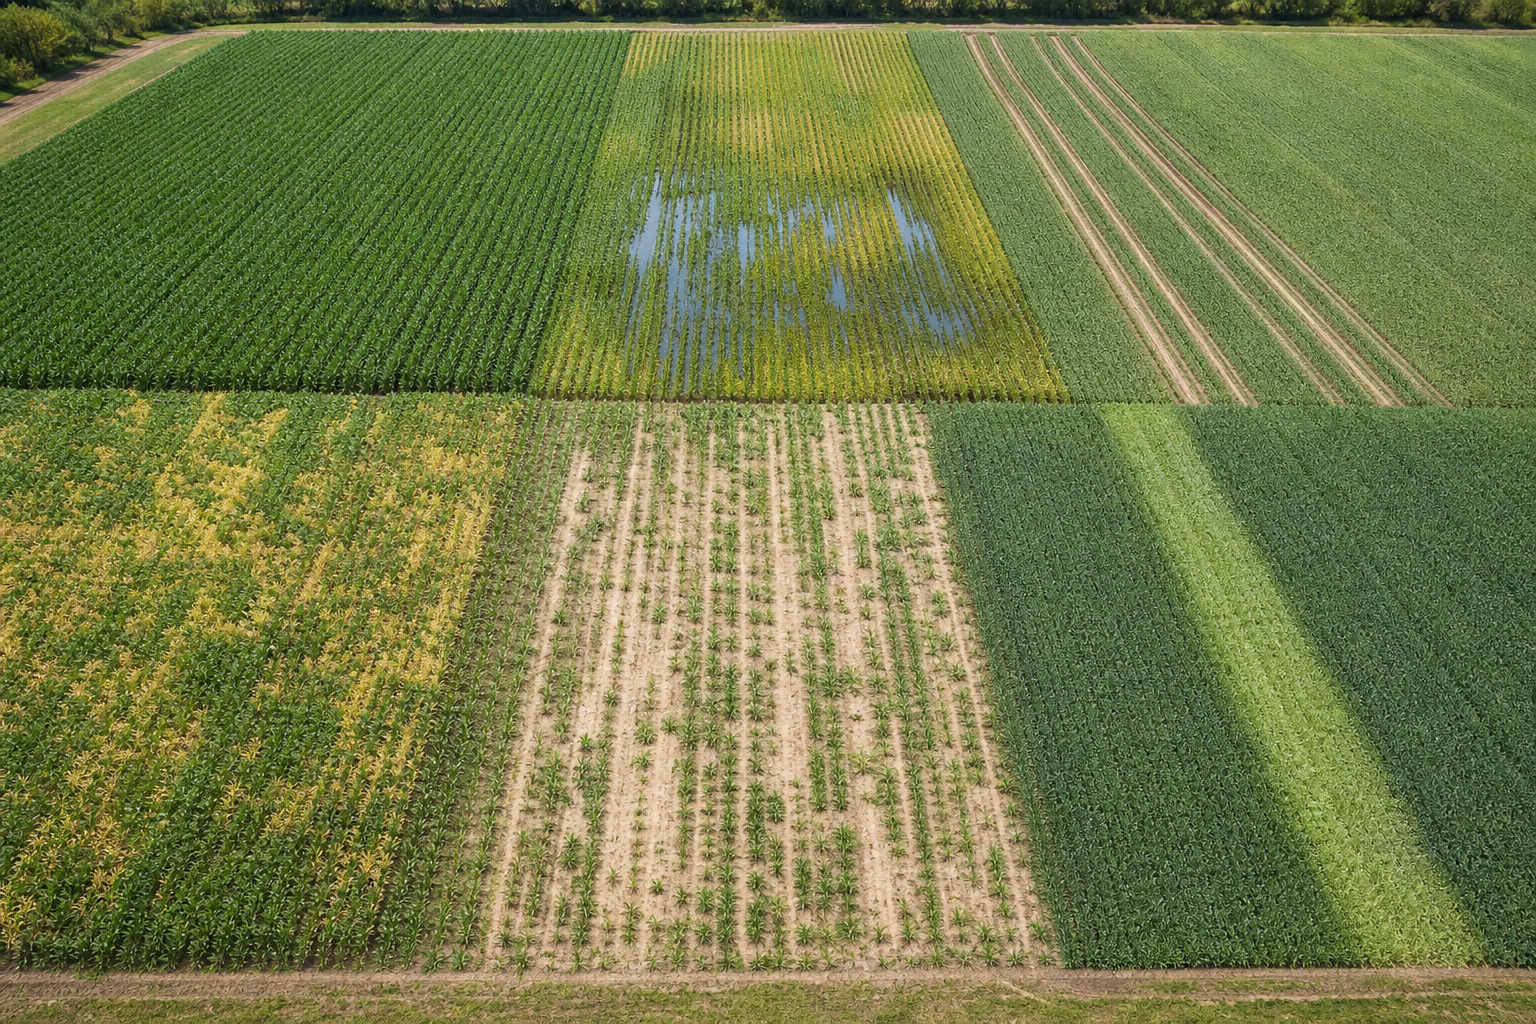
Common agronomic causes of uneven crop growth
The same visible symptom can have several possible causes. A yellow patch may be related to fertility, water, disease, compaction, herbicide injury, or a seeding issue. That is why it helps to think through the most common crop growth problems before entering the field.
Soil fertility variation
Soil fertility is rarely uniform across a whole field. Historical fertilizer placement, manure history, organic matter, pH, lime response, soil texture, and nutrient removal can all vary by zone. As a result, one part of the field may support strong root growth and canopy development while another area stays pale, slow, or thin.
Fertility-related uneven crop growth often follows soil type boundaries, past management zones, old field divisions, or places where applications were missed or overlapped. Soil sampling and tissue testing may be needed before making a nutrient decision.
Water stress and drainage problems
Water stress can show up in both wet and dry conditions. Low spots may stay saturated after rain, slowing root growth and reducing oxygen in the root zone. Poor drainage can also increase nutrient loss or create conditions that favor disease.
In irrigated fields, uneven sprinkler coverage, plugged emitters, pressure differences, or irrigation scheduling can create visible growth variation. In dryland fields, sandy ridges, shallow soils, and exposed slopes may show drought stress earlier than heavier or deeper soils.
Soil compaction
Compaction limits root development, water movement, and nutrient uptake. It can delay emergence, reduce stand uniformity, and make plants more sensitive to dry or wet periods. Common locations include headlands, grain cart paths, repeated traffic lanes, field entrances, and areas worked when soil was too wet.
Compaction patterns often look linear or traffic-related. When scouting, compare root depth, sidewall smearing, soil structure, and moisture differences between the affected zone and a nearby healthy zone.
Pest or disease pressure
Pests and diseases often begin in specific pockets rather than across the whole field at once. Early pressure may appear near field edges, waterways, volunteer crop areas, compacted zones, or places with heavier residue or humidity.
Because many pest and disease symptoms overlap with nutrient or water stress, scouting should include plant inspection, leaf symptoms, root checks, stand counts, pest thresholds, and crop stage. A crop stress detection layer can point you to the zone, but diagnosis still happens in the field.
Planting or seeding issues
Uneven planting depth, skipped rows, doubles, poor seed-to-soil contact, variable residue conditions, inconsistent closing wheel pressure, seed quality differences, or cold and wet emergence conditions can all create an uneven stand.
Planting-related problems are often easiest to confirm early in the season. Look for repeated row patterns, seed depth variation, crusting, residue hairpinning, and areas where emergence timing differs from the rest of the field.
Herbicide injury or spray overlap
Herbicide injury, spray overlap, tank contamination, drift, wrong timing, or crop sensitivity can cause strips or localized areas of stunting, yellowing, leaf twisting, or stand thinning. These patterns may follow boom width, field borders, wind direction, or turn rows.
The shape of the affected area is especially useful here. A clean edge, repeated width, or overlap pattern can suggest that the sprayer setup, application record, or weather conditions during spraying should be reviewed.
Machinery operation problems
Machinery issues can show up as crop variability even when the original problem was operational. Changes in speed, skips, overlaps, blocked nozzles, poor spreader calibration, row-unit problems, section control delays, or inaccurate guidance can create visible field patterns.
These problems are not always obvious from the cab. When a growth pattern repeats with equipment width, tramlines, turns, or field passes, it is worth checking operation records, calibration settings, and the machine before the next job.
Pattern matters: what the shape of the problem can tell you
The shape of a problem does not diagnose it with certainty, but it can tell you where to start. A practical crop scouting workflow looks at both the crop symptom and the pattern around it.
| Field pattern | What it may suggest | What to check first |
|---|---|---|
| Straight lines or strips | Planter, sprayer, fertilizer spreader, guidance, section control, or other machinery-related issues. | Pass width, operation records, nozzle flow, spreader calibration, seed depth, overlaps, and skips. |
| Low spots | Drainage problems, waterlogging, delayed emergence, nutrient loss, or root stress. | Soil moisture, root health, residue, drainage outlet, and recent rainfall. |
| Field edges | Pest pressure, shading, compaction, drift, wildlife pressure, or edge-related soil differences. | Leaf symptoms, stand count, pest presence, drift direction, and border conditions. |
| Random patches | Soil variation, disease clusters, pest pressure, weeds, nutrient deficiency, or localized compaction. | Plants, roots, soil texture, weeds, and nearby healthy areas for comparison. |
| Headlands | Compaction, turning damage, repeated traffic, application overlap, or equipment delays. | Soil structure, traffic patterns, wheel tracks, and operation timing. |
| Areas following soil type changes | Fertility, moisture, organic matter, pH, or texture differences. | Soil maps, soil tests, pH, moisture, and yield history if available. |
Why scouting every part of the field is inefficient
Field scouting takes time, especially across large fields. Without a map, it is easy to check only the road edge, the headland, or the easiest place to enter. Those areas are useful, but they may not represent the real problem zones.
Not every acre has the same level of risk. A smarter approach is to use crop health monitoring, aerial imagery, machine records, or field observations to prioritize zones before walking the field.
The goal is not to avoid scouting. The goal is to scout the right places first, compare them with healthier zones, and use the time in the field more effectively.
How to decide where to scout first
-
1
Start with the most abnormal zones
Prioritize areas where crop color, vigor, canopy cover, or stand density is clearly different from the rest of the field.
-
2
Check transition areas
Walk the boundary between strong and weak crop growth. Transitions can help show whether the issue follows soil, water, fertilizer, or operation patterns.
-
3
Compare high-growth and low-growth zones
Do not only inspect the weak area. A nearby strong zone gives you a reference for roots, stand count, moisture, disease, pests, and crop stage.
-
4
Visit areas with repeating patterns
Strips, edges, wheel tracks, and repeated shapes should be checked early because they can suggest equipment, traffic, or application causes.
-
5
Record what you find
Capture photos, location, crop stage, symptom type, likely cause, and follow-up needs. Good notes make later management decisions easier.
Turning scouting results into management zones
Scouting is not the end of the process. It is the step that turns a visible field difference into a decision. After checking the field, a farmer or agronomist can group areas into practical crop management zones.
- Low vigor zone: check soil, drainage, pests, disease, compaction, or nutrient deficiency before choosing an action.
- Normal zone: continue standard management and use it as a comparison point for weaker areas.
- High vigor zone: evaluate whether input rates should stay the same, be protected, or be adjusted based on the crop plan.
- Problem zone: create a follow-up task, spray plan, fertilizer plan, soil sampling plan, or monitoring plan.
From agronomic observation to field action
Agronomic observation has value when it leads to a practical next step. That next step should match what you actually confirmed in the field, not what the map alone appeared to show.
- Targeted scouting
- Soil sampling
- Adjusted fertilizer planning
- Variable rate spraying with a prescription map when conditions support variable rate application
- Drainage improvement
- Replanting or reseeding decisions
- Pest or disease treatment
- Machinery calibration checks
- Follow-up monitoring after an operation
Scouting workflow
Crop health map
Priority zones
Field observation
Management zones
Operation plan
A practical workflow moves from crop health monitoring to targeted field scouting, then to zones and operation plans that can be reviewed after the job.
How FieldFusion helps farmers scout and manage field variability
FieldFusion helps connect field observation, map-based planning, and operation execution. It should not be treated as a tool that diagnoses every agronomic problem from a distance. Instead, it helps farmers move from "I see uneven growth" to "I know where to check, what to record, and how to plan the next operation."
With NDVI crop monitoring and crop health maps, FieldFusion can help spot field variability and compare conditions across different zones. Farmers can manage field boundaries, organize field information, and use maps to support crop scouting decisions.
After scouting, FieldFusion can help create tasks or operation plans based on problem areas. When variable rate application is needed, users can create prescription maps, export ISOXML, GeoJSON, and Shapefile files, and sync plans with FJD or SVEA auto-steer systems.
The workflow can continue after the job with operation records and reports. FieldFusion AI Assistant can also support users as they think through possible causes or next steps, while the final decision still needs field scouting, soil and weather context, and agronomic judgment.

Practical example
A farmer notices that one part of a wheat field appears lighter and less vigorous than the rest of the field. Instead of walking the whole field randomly, the farmer checks the crop health map, identifies three low-vigor zones, and visits those areas first.
In the field, one zone has poor drainage, another shows signs of nutrient deficiency, and a third follows a repeated machinery track. Based on those findings, the farmer can plan different follow-up actions instead of treating the entire field the same way.
Key takeaway
Uneven crop growth should not be ignored, but it should also not be guessed from a distance. The strongest workflow combines crop health maps, crop scouting, agronomic judgment, and farm management software that helps turn observations into organized field action.
FAQ
Frequently Asked Questions
What causes uneven crop growth? +
Uneven crop growth can be caused by soil fertility variation, water stress, drainage problems, compaction, pests, disease, planting issues, spray overlap, machinery problems, or differences in crop stage. The visible pattern is a starting point, not a final diagnosis.
How can I identify crop stress in a field? +
Start by looking for differences in crop color, canopy cover, plant height, emergence, maturity, or stand density. Crop health maps, NDVI crop monitoring, aerial images, and field observations can help locate abnormal zones before you scout them in person.
Can NDVI show uneven crop growth? +
Yes. NDVI can help reveal areas with different vegetation vigor, canopy density, or crop cover. It is useful for spotting field variability and deciding where to scout first.
Does NDVI tell me the exact cause of crop stress? +
No. NDVI can show that part of a field is different, but it does not confirm the exact cause. A low-vigor area should still be checked with field scouting, weather context, soil information, crop stage, and agronomic judgment.
What areas should I scout first in an uneven field? +
Scout the most abnormal zones first, then check transition areas between strong and weak growth, compare high-growth and low-growth zones, and visit areas with repeating strips, edge patterns, headland stress, or machinery-like tracks.
How can crop scouting maps help farm management? +
Crop scouting maps help narrow the scouting area, organize field observations by location, compare zones, and connect findings to follow-up actions such as soil sampling, spraying, fertilizer planning, drainage work, or monitoring.
Can uneven crop growth be caused by machinery problems? +
Yes. Straight strips, repeated gaps, overlaps, clogged nozzles, planter issues, fertilizer spreader calibration problems, and traffic compaction can all show up as crop growth problems or field variability.
How does FieldFusion help with crop monitoring and scouting? +
FieldFusion helps farmers view crop health maps, compare zones, manage field information, plan scouting tasks, create prescription maps when variable rate application is needed, export compatible files, sync plans with equipment, and review operation records after the job.
FieldFusion
Turn Field Variability into Smarter Farm Decisions
FieldFusion helps you view crop conditions, identify field variability, plan scouting and operations, create prescription maps, and connect decisions with field execution.