Your field is not the same everywhere
Some areas grow strongly. Some areas look weaker. Some zones may be affected by soil differences, water stress, compaction, pests, disease, or uneven application history.
The problem is simple: from the ground, these differences are not always easy to see.
NDVI helps make crop differences visible from above. With an NDVI map, you can better understand where your field is growing differently and use those differences to create better management zones.
That is why NDVI is often a useful starting point for prescription maps.
What is NDVI?
NDVI stands for Normalized Difference Vegetation Index, but you do not need to remember the full name to use it.
In simple terms, NDVI is a crop-growth score calculated from satellite or remote sensing imagery. Think of it as a quick crop check from above.
Instead of walking every row first, you can look at the NDVI map and quickly see which parts of the field look strong, which parts look weak, and which areas may have little or no crop cover.

How to read an NDVI map
NDVI maps are often shown with colors, but different platforms may use different color scales. So it is safer to look at the NDVI value first, then use the color as a visual guide.
A higher NDVI value usually points to denser, greener vegetation. A lower value may point to weak crop growth, bare soil, water, roads, shadow, or another non-crop surface.
| NDVI value | What it usually means |
|---|---|
| -1 to 0 | Water, shadow, snow, or non-crop surface. |
| 0 to 0.1 | Bare soil, roads, rock, or dry surface. |
| 0.1 to 0.2 | Very sparse vegetation or seedlings. |
| 0.2 to 0.3 | Low cover or weak early growth. |
| 0.3 to 0.5 | Medium cover, moderate crop vigor. |
| 0.5 to 0.7 | Good crop growth and leaf cover. |
| 0.7 to 0.8 | Strong, healthy, dense vegetation. |
| 0.8 to 1.0 | Very dense peak-season crops or forest. |
For example, if a 10-acre corn field shows one low-NDVI patch in the southwest corner, you do not need to inspect the whole field first. You can go directly to that area and check for possible water stress, nutrient problems, pests, emergence issues, or another local cause.
How is the NDVI number calculated?
The principle is simple: healthy green leaves handle red light and near-infrared light differently. This is the same core idea described by NASA Earth Observatory.
Red light: healthy green leaves absorb a lot of red light for photosynthesis. Weak, yellow, or sparse plants absorb less red light, so more red light is reflected back.
Near-infrared light: healthy green leaves reflect a lot of near-infrared light, even though our eyes cannot see it. The stronger and denser the crop canopy, the more near-infrared light it usually reflects.
A satellite or sensor records how much red light and near-infrared light comes back from the field. NDVI compares those two measurements with a simple formula: reflected near-infrared light minus reflected red light, divided by their total.
NDVI formula
For example, healthy green leaves may reflect much more near-infrared light and much less red light, producing a high NDVI value. Weak or yellowing leaves usually reflect less near-infrared light and more red light, producing a lower NDVI value.

That calculation turns the result into a value between -1 and 1. You do not need to calculate it by hand. The useful part is that the value helps turn a satellite image into a field map you can act on.
What can NDVI help you see?
NDVI helps answer one important question:
"Where is the field different?"
It can help reveal patterns such as:
- Stronger crop growth in one part of the field
- Weaker vegetation in another area
- Possible water stress or drainage problems
- Crop zones that may need closer inspection
- Differences that may support variable-rate planning
NDVI does not diagnose the exact problem by itself.
A low NDVI area could be caused by many factors: lack of water, poor soil fertility, pests, disease, compaction, crop stage differences, image quality, or even clouds.
That is why NDVI should be used together with field knowledge, scouting, soil data, yield history, or agronomist recommendations.
NDVI helps you know where to look. Your experience helps you decide what to do.
Can NDVI help reduce waste?
NDVI itself does not directly save water, fertilizer, or chemicals.
The savings come from how you use the information.
When you apply the same rate across the whole field, every area is treated as if it has the same condition and the same need. But most fields are not uniform.
With NDVI, you can identify stronger and weaker zones, then use those zones to support more targeted planning.
Depending on your crop, equipment, field conditions, and agronomic advice, NDVI may help you:
- Avoid treating every part of the field the same way
- Identify areas that need closer inspection
- Support variable-rate fertilizer planning
- Support more targeted spraying decisions
- Compare crop development across different dates
- Build zones for prescription map workflows
NDVI is not a replacement for agronomy. It is a decision-support layer that helps you see the field more clearly before you act.
From NDVI to prescription maps
A prescription map is a field map that tells compatible equipment where different application rates or actions should be used.
NDVI can support this process by helping you turn crop differences into zones.
View NDVI
Create zones
Set rates
Create prescription map
Export file
NDVI -> Zones -> Rates -> Prescription Map -> Export
First, you view the NDVI map to understand crop variability.
Then, you divide the field into practical zones. For example, you may create high-vigor, medium-vigor, and low-vigor zones.
Next, you set different application rates for different zones. These rates should be based on crop needs, product label instructions, field experience, soil or yield data, or agronomist recommendations.
Finally, you create a prescription map and export the file for compatible equipment workflows.
This is how field differences become a practical field operation plan.
Prescription workflow
Ready to turn NDVI into a prescription map?
How FieldFusion Pro helps
Once NDVI shows where the field is different, the next question is: how do you turn those differences into an operation plan? With FieldFusion Pro, NDVI becomes a field layer you can check, compare, and turn into practical prescription map workflows whenever you need it.
01
Check NDVI anytime
With FieldFusion Pro, you can check a field's NDVI condition as often as you need, anytime and anywhere. That makes it easier to keep watching crop growth without waiting for a field visit or starting the map workflow from zero each time.

02
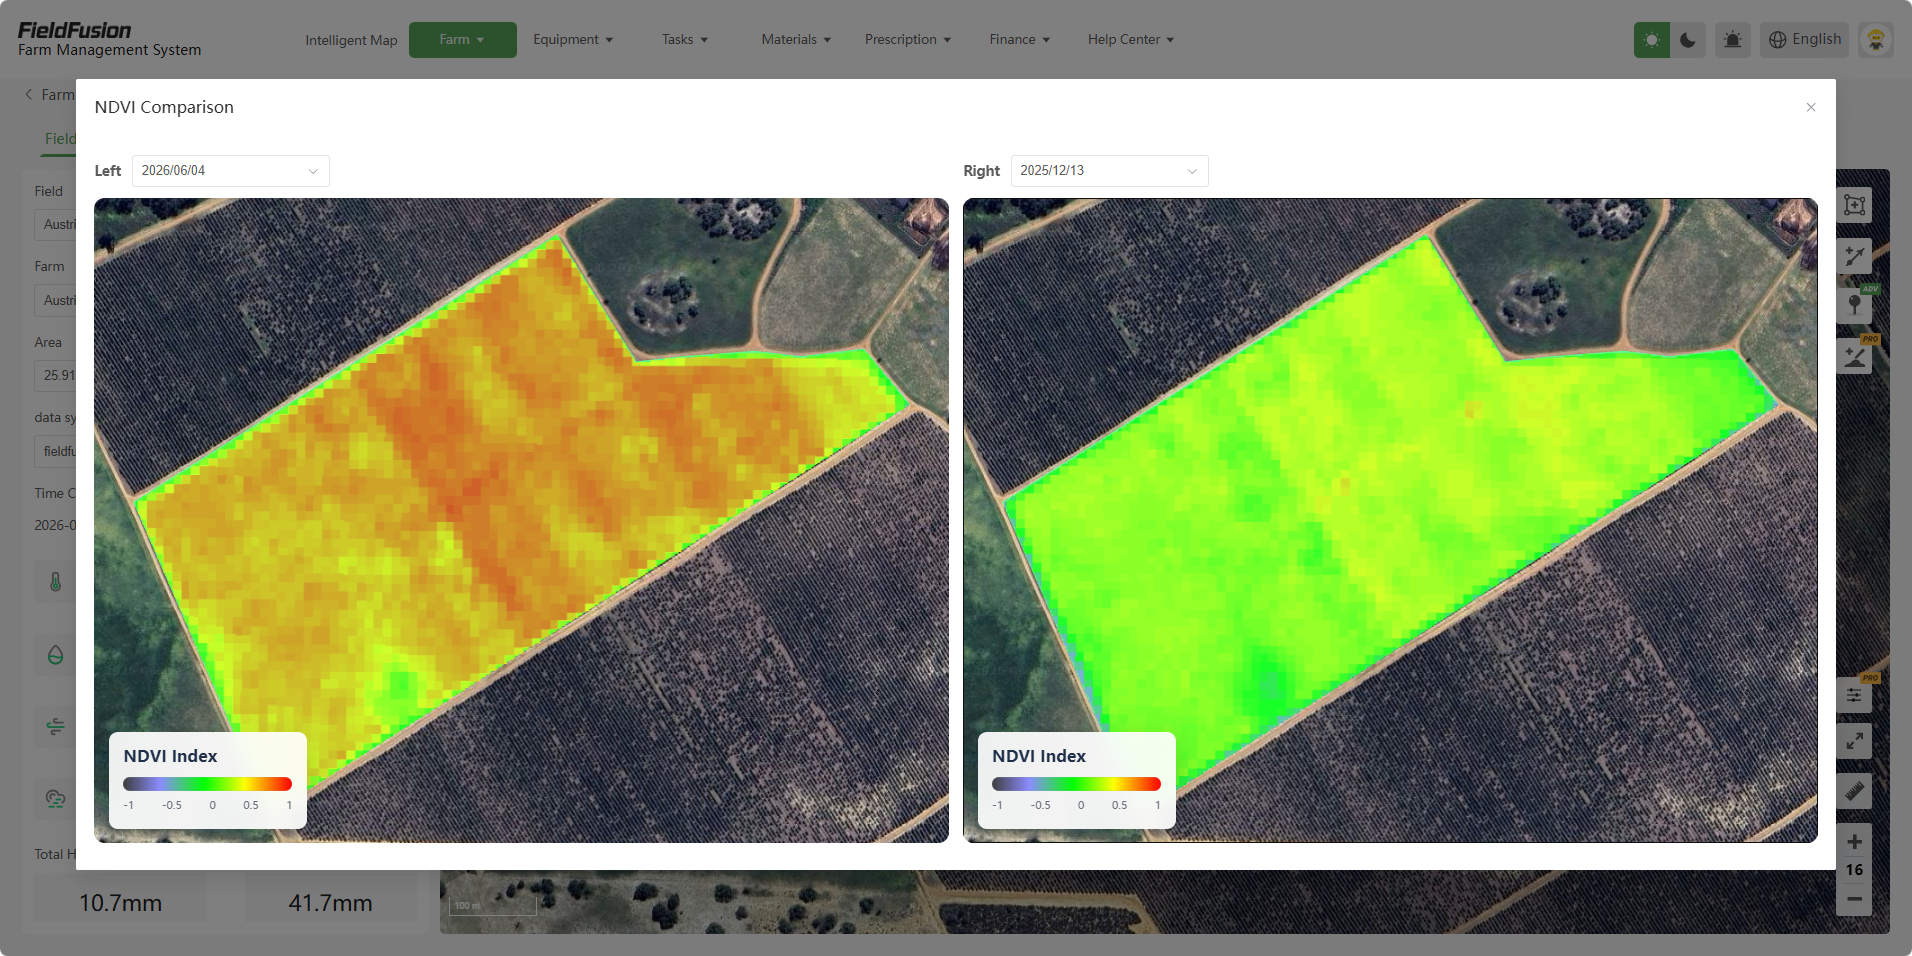
Compare two dates
You can compare NDVI for the same field on two different dates. This helps you understand whether the crop is improving, weakening, or changing unevenly, and it gives you a clearer starting point for scouting problem areas.
03
Create and export prescription maps
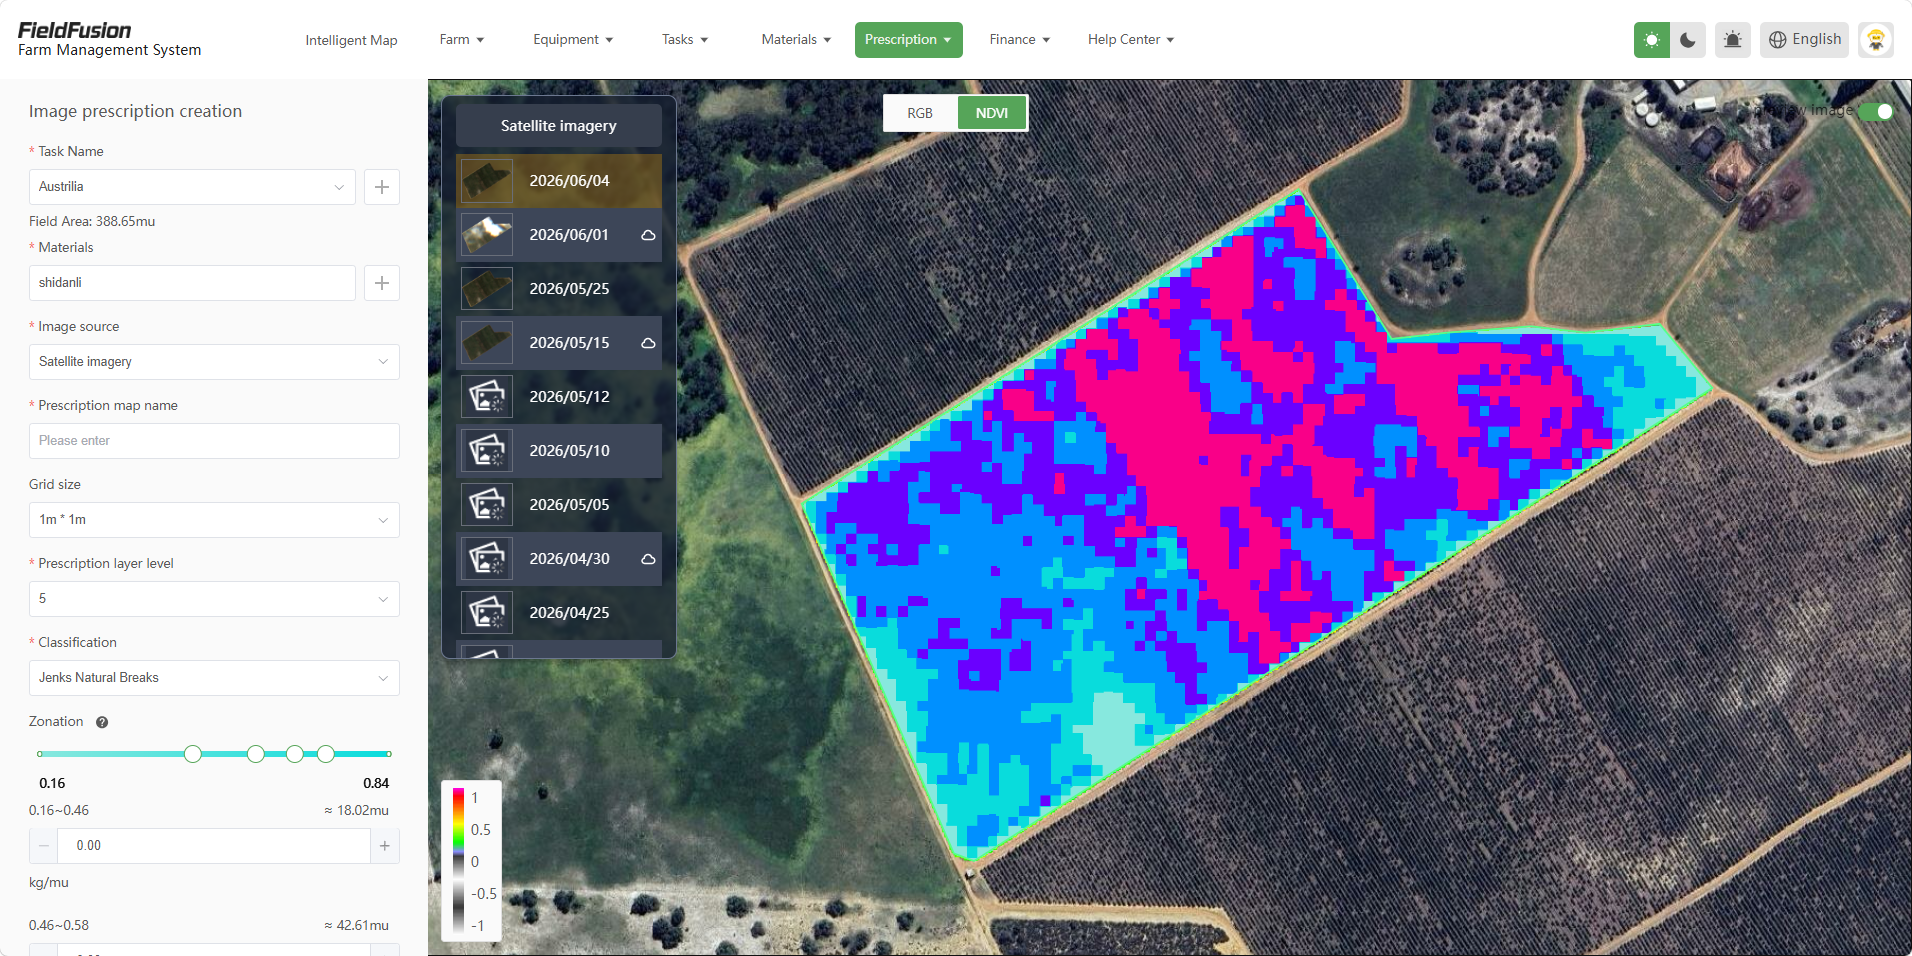
You can use NDVI imagery repeatedly to create prescription maps for the same field, then export or sync the result to compatible equipment. This turns crop-growth differences into practical instructions for more precise field operations.
Create or select your field
Start with your field boundary and keep field information in one place.
View NDVI imagery
Open the field's NDVI layer to understand crop variability.
Create management zones
Turn visible crop differences into practical zones.
Set application rates
You remain in control of the rates. FieldFusion helps build the map, but you decide the plan.
Create a prescription map
Turn zones and rates into a prescription workflow.
Export or sync to equipment
Send prescription files into compatible equipment workflows for field execution.
See your field differently before you apply
Your field already has differences.
NDVI helps you see them.
Prescription maps help you act on them.
Instead of asking, "Should I apply the same rate everywhere?" you can start asking, "Which zones need a different plan?" That is the beginning of smarter field management.
Try the workflow
Start turning NDVI maps into field-ready prescriptions
FieldFusion Pro helps you view NDVI imagery, create zones, set application rates, and export prescription map files for compatible equipment workflows.
Talk to your dealer to know more.